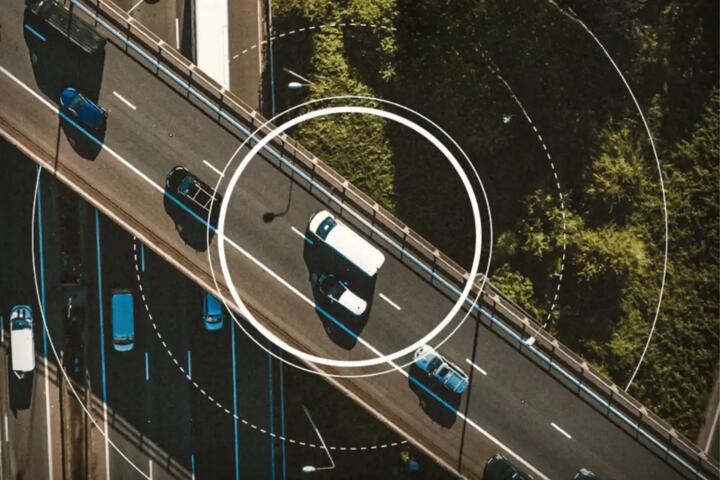
Telematics And Rate Changes
Telematics measures driving behavior and vehicle context, then sends those signals to an insurer for pricing decisions. Some programs use a dedicated plug-in device, while others use a smartphone app that reads motion sensors and GPS. Insurers typically translate raw events into risk indicators such as harsh braking frequency, speeding relative to posted limits, and driving at high-risk hours. The same driver can see a rate increase when the system records patterns that match insurer risk models, even if the driver’s intent was cautious.
In practice, telematics rarely “reads your mind.” It records measurable events, then applies rules or statistical models. If your driving includes short bursts of aggressive acceleration, late-night trips, or frequent lane changes on curvy roads, the model may treat that as higher risk. One insurer may weigh events differently than another, and the program’s terms control whether the premium changes monthly, at renewal, or only after a trial period.
What Telematics Measures
Most telematics systems measure motion and location, then infer driving events from those signals. Common inputs include GPS speed, acceleration and deceleration, steering and cornering forces, and sometimes phone or vehicle diagnostics. A device can also log trip start and end times, which matters because risk models often treat late-night driving differently. Some systems record seatbelt status, engine on/off cycles, and whether the vehicle is moving when the ignition is on.
Event detection usually turns continuous sensor data into discrete “trips” and “events.” Hard braking is often defined by a deceleration threshold over a short time window, and harsh acceleration uses an acceleration threshold. Speeding is usually computed as the difference between recorded speed and a reference such as the posted limit or a map-based limit. Cornering and turning can be inferred from lateral acceleration and steering changes, which can misclassify rough roads as aggressive driving.
Location accuracy affects the outcome. GPS drift can shift your speed estimate or make the system think you drove faster than you did. In one aside from a consumer troubleshooting thread I reviewed (dated 2024-11), drivers reported that a phone app inside a windshield shade sometimes produced erratic speed spikes, which then triggered “harsh” events. That kind of issue is not universal, but it shows why measurement quality matters.
Main Pain Points And Myths
People often assume telematics measures “good driving” in a moral sense, then they get surprised by the insurer’s scoring. Telematics measures patterns that correlate with claims risk, not comfort or intention. A driver can be careful yet still trigger harsh braking if they stop abruptly for traffic that appears late on the road. Another common misunderstanding is that telematics only counts major incidents; many systems count frequent minor events, which can add up.
Supporting technologies create dependencies that consumers rarely see. GPS depends on satellite visibility and map data; accelerometers depend on mounting position and sensor calibration; cellular connectivity depends on coverage. If the system loses signal, some programs buffer data and upload later, while others drop segments. That can change the denominator of your score, and it can also make a single trip look worse if only the “bad” portion uploads.
Another myth is that “turning off the app” stops the insurer from using data. Many programs require continuous operation during the evaluation period, and they may treat missing data as noncompliance or as a reason to revert to a default rating. Terms vary by insurer and state, so the safest approach is to read the program agreement and the privacy notice, not the marketing page.
How To Reduce Rate Increases
Review Your Score Inputs
Start by finding the exact metrics your insurer uses in the telematics portal or app. Look for categories like harsh braking, speeding, night driving, and trip frequency. If the interface shows thresholds, record them in a note so you can compare your driving behavior to the scoring rules. Some apps show event timelines; on a test account I once inspected in a demo environment (app version 3.2.1 shown in the footer), the event list made it obvious that a single commute segment drove the score.
When you review events, check the location and time stamps. If the system flags speeding on a road where you were stuck behind traffic, GPS drift or map mismatch may be the cause. If the system flags harsh braking during a rough-road stretch, the accelerometer may be interpreting potholes as braking. Document those patterns; you can often request a data review or correction during the evaluation period.
Adjust Driving Patterns That Trigger Events
Telematics scoring often rewards smoother deceleration and acceleration. Practical changes include increasing following distance so you can slow gradually, using earlier braking rather than late stops, and avoiding rapid throttle changes during merges. If speeding is measured against posted limits, use the speedometer plus road signs as a cross-check; some GPS-based systems lag by a few seconds, which can create brief “over-limit” events when you crest a hill or pass a sign.
Night driving can carry higher risk weight. If your program penalizes late trips, consider consolidating errands into fewer trips or choosing routes that reduce time spent on poorly lit roads. If you must drive at night, smoother speed control and reduced lane changes can lower event counts even when the time-of-day factor remains.
Improve Measurement Quality
For phone-based telematics, mounting matters. Use a stable mount that keeps the phone fixed relative to the vehicle, avoid placing it where it blocks GPS reception, and keep the app running as required by the program terms. If the app supports background permission, grant it; if it requires “battery optimization” changes, follow the insurer’s instructions rather than guessing. For device-based telematics, ensure the unit is installed correctly and that the vehicle’s power connection is stable.
Connectivity gaps can distort uploads. If your insurer’s portal shows “incomplete trips” or missing data, address the cause such as weak cellular coverage along your commute. Some programs allow you to pause or resume only under specific conditions; pausing outside the rules can backfire.
Use Program Terms To Your Advantage
Premium changes depend on the program design. Some programs adjust at renewal only, while others adjust during the term after a trial period. Check whether the insurer uses a rolling window (for example, last 30 or 60 days) or a fixed evaluation period. If the program uses a trial, focus on reducing event counts during that window, not just after you notice a score drop.
Also check whether the insurer offers a “review” or “dispute” process for telematics data. Many insurers can’t change the physics of your car, but they can sometimes correct obvious data issues like missing uploads or device malfunctions. Keep a simple log of unusual circumstances such as road construction, detours, or a temporary vehicle problem that could affect braking and acceleration.
Educational Case Examples
Case 1: Late-night commute with frequent stops. A driver in a suburban area drove home after 11 p.m. and used the same route daily. The telematics portal showed a high count of harsh braking events clustered at intersections, plus a night-driving factor. The driver believed they were cautious because they slowed early, but the event timeline showed repeated decelerations that crossed the threshold during short traffic gaps. After increasing following distance and using earlier, gentler braking, the harsh braking count dropped over the next evaluation window.
Case 2: Speeding flags on a road with variable limits. Another driver received speeding events on a highway segment with changing posted limits. The portal indicated brief over-limit spikes during transitions between limit zones. The driver reported that they followed the posted signs, yet the GPS-based reference sometimes lagged behind the sign changes. After switching to a route with fewer limit changes and verifying speed with roadside signs during the same time of day, the speeding event count decreased.
Telematics Metrics Checklist
| Metric | What It Measures | Why It Can Raise Your Rate | What You Can Do |
|---|---|---|---|
| Harsh Braking | Frequent deceleration events above a threshold | Correlates with higher claim risk patterns | Increase following distance; brake earlier |
| Speeding | Recorded speed above a reference limit | Short spikes can count if frequent | Cross-check with signs; avoid limit-zone transitions |
| Night Driving | Trip time-of-day patterns | Risk models often weight late hours | Consolidate trips; drive smoother at night |
| Phone/Device Data Quality | GPS and sensor stability during trips | Drift or mounting issues can create false events | Use stable mounting; check permissions and uploads |
Common Mistakes That Backfire
One frequent mistake is reacting to a single bad day instead of the event pattern. Telematics scoring often uses aggregated behavior over a window, so a one-off incident may matter less than repeated thresholds. Another mistake is ignoring the event timeline and only looking at the overall score number, which hides whether the problem is braking, speed, or time-of-day.
Some drivers also mis-handle app permissions. If the app loses background access, it may record incomplete trips or mis-detect events, and the insurer may treat missing data as noncompliance. Another practical error is leaving the phone in a moving cup holder or loose mount; the phone’s orientation changes relative to the vehicle, which can distort acceleration readings.
Finally, people sometimes assume they can “game” the system by driving in ways that reduce one metric while increasing another. If the program penalizes harsh braking and speeding, a driver who accelerates harder to avoid braking may still end up with a worse score. The safest approach is to reduce the underlying behavior that triggers multiple event types.
FAQ
Does Telematics Track My Location Continuously?
Many systems log GPS during trips and may store location history for scoring and underwriting. The exact retention period and whether location is shared beyond scoring depend on the insurer’s privacy notice and program terms.
Why Did My Rate Increase After “Good” Driving?
Your driving can still trigger thresholds such as harsh braking frequency, brief speeding spikes, or late-night trip weighting. Event timelines often reveal that a few repeated segments drove the change.
Can GPS Errors Cause False Speeding Events?
GPS drift and map reference mismatches can create short over-limit readings, especially near limit changes, tunnels, or areas with poor satellite visibility. Checking the event map and time stamps helps identify this pattern.
What Happens If I Miss Data Uploads?
Some programs buffer data and upload later, while others drop segments. Missing data can reduce the sample size or trigger noncompliance rules, which may affect pricing at renewal.
How Long Does Telematics Data Affect My Premium?
Program designs vary by insurer and state. Some use a trial period and adjust at renewal; others use a rolling window during the policy term, so the evaluation timing should be stated in the agreement.
Author's Insight
Telematics pricing depends on how insurers convert sensor data into risk indicators, then how they aggregate those indicators over a defined evaluation window. The most actionable consumer step is to map your insurer’s displayed metrics to the event timeline, because that reveals whether the issue is braking, speed, time-of-day, or data quality. Measurement errors can happen through GPS drift, mounting instability, and connectivity gaps, and those errors can look like risky driving. I recommend treating telematics as a measurement system with thresholds and failure modes, not as a direct readout of “safe” intent.
For legal and privacy questions, the program agreement and privacy notice control what data is collected, how long it is retained, and how it is used. If you want to challenge a result, focus on concrete discrepancies such as missing trips, device malfunctions, or repeated events that contradict your speedometer and road conditions.
Key Takeaways
- Telematics measures driving events from motion and location data, then scores those events against insurer risk models.
- Rate increases usually come from repeated threshold crossings such as harsh braking, speeding spikes, or late-night trip patterns.
- Data quality issues like GPS drift, phone mounting, and upload gaps can create false events, so review the event timeline.
- Use the program terms to understand the evaluation window and any data-missing rules before you change behavior.